My first questions were about who was using the app and what sort of messages were being sent. Here's a summary of the most interesting findings.
WHO ARE OUR USERS?
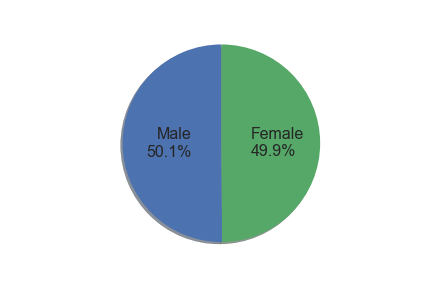
Gender of Users
Impressively even split of men and women.
According to the data, 100% percent of users identify as male or female (i.e. there were no empty values and no values besides male and female). Because the population of the US as a whole doesn't neatly divide themselves into two groups, some people may be either purposefuly mis-identifed themselves or decided to not use the app.
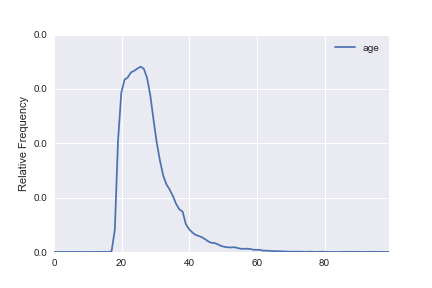
Age of Users
There are no users below 18 (probably because the app doesn't allow it). There are more and more users through the college ages, perhaps as students drop out or move off campus, and then a pretty steep drop off begining around age 23.
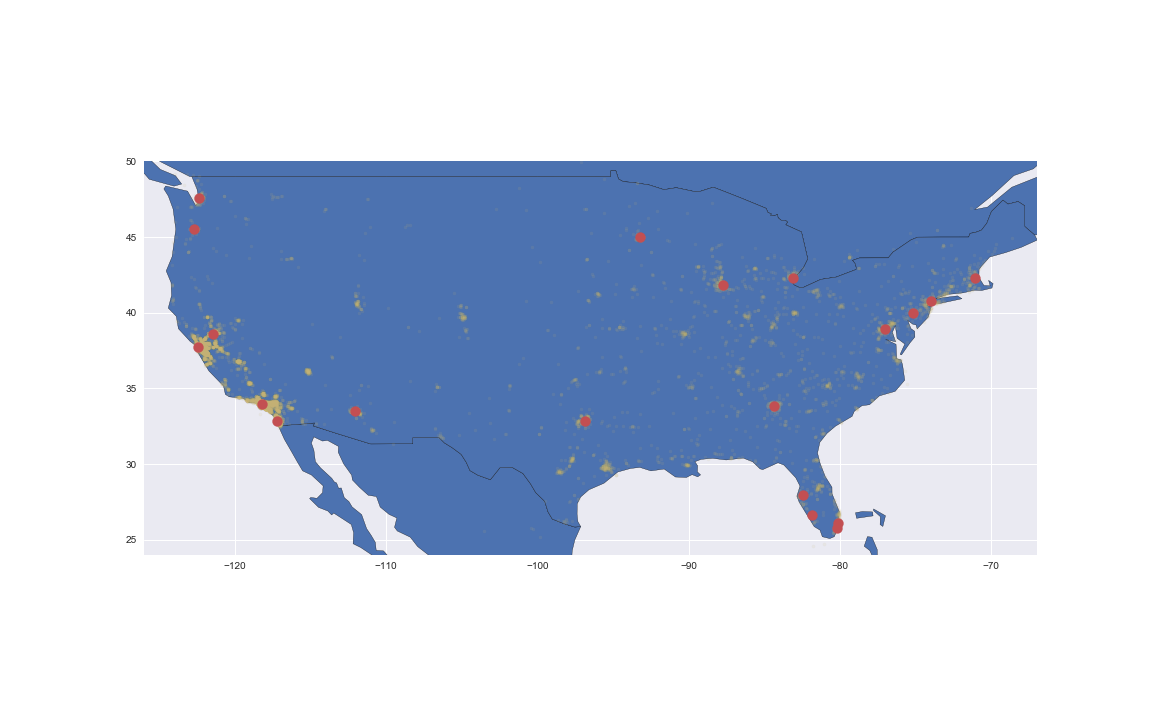
Location of Users
Users cluster around cities, with an especially large contingent in the bay area and Los Angeles.
When are Users Signing Up?
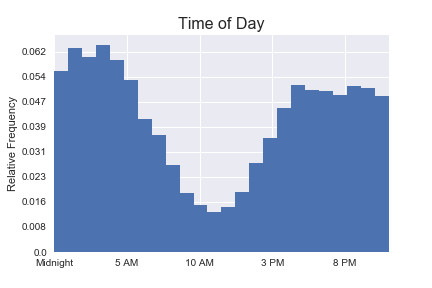
Time of Day As if purposefully trying to adhere to stereotypes, users are most active in the late evening and into the wee hours of the morning. They are least likely to sign up during work hours.
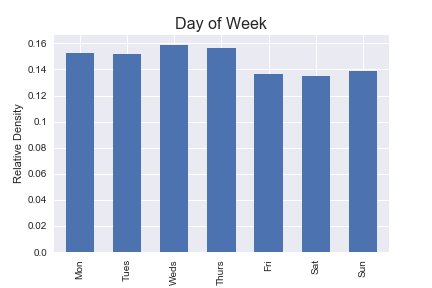
Day of Week There's not a strong day-of-week effect, although users do seem fractionally less likely to sign up over the weekend.
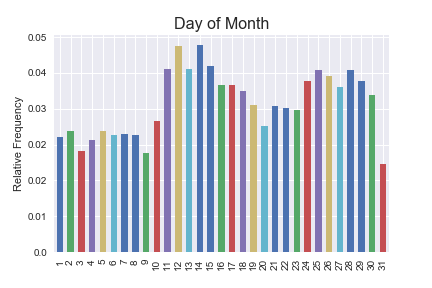
Week of Month The day of the month does seem to have a strong effect on when users sign up. For the first week, sign ups are low, but then they peak in the second week, drop in the third week, and then go back up in the fourth week. Low sign-ups on the 31st only because not every month has one.
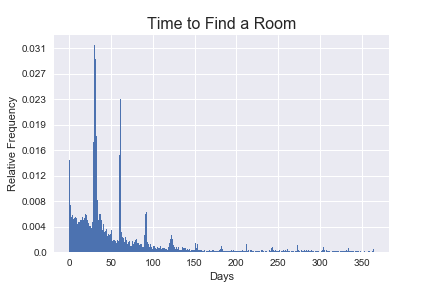
How long do users have to find a place?
About 3500 users put a date either in the past or over a year in the future. A lot of users selected a date a month, two months, or three months out.
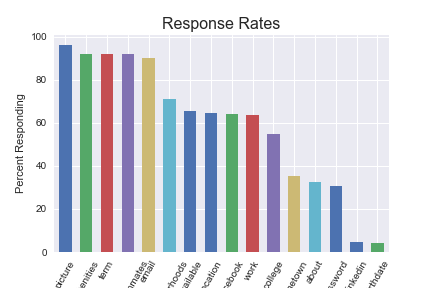
What information are users sharing?
When users sign up, they are prompted to input information about themselves and their ideal apartment. From most to least popular, this is what percent of users shared each piece of information.
WHAT ABOUT THE MESSAGES?
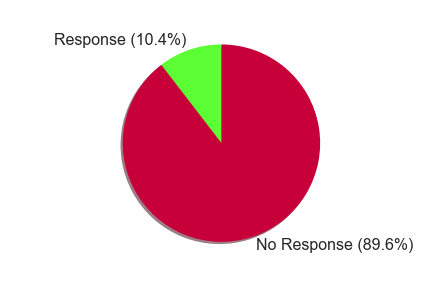
How Many Messages Earn a Response?
The most important graph! Only about 10% of messages get a response.
How Long are the Initial Messages?
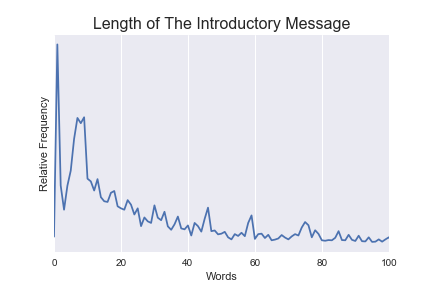
Length of First Message There are a lot of one-word messages (usually "hi!"), but most first messages are in the eight to ten word length.
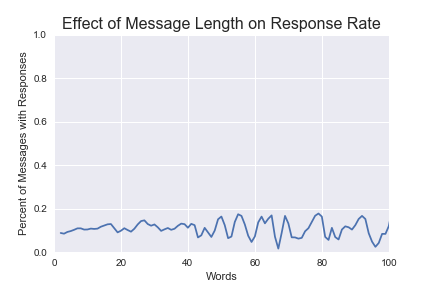
Effect on Response Rate The really short messages do just a shade worse than longer messages, and the optimal length seems to be in the mid twenties.
How has the number of messages changed over the life of the app?
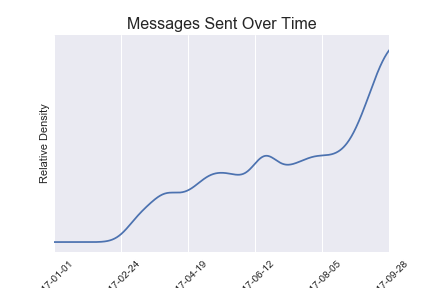
Date of First Message Messages sent are increasing rapidly, which is good!
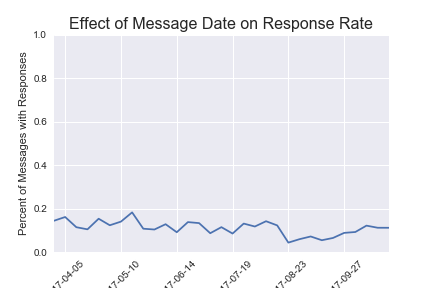
Effect on Response Rate Over time, the response rate has decreases a little.
When are Users Sending Messages?
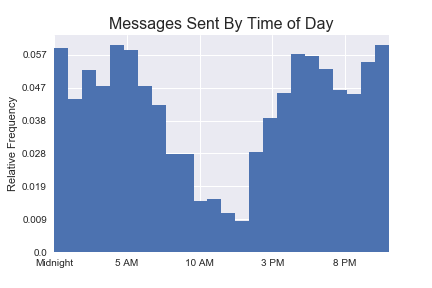
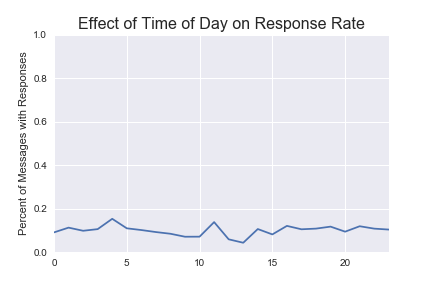
Time of Day As if purposefully trying to adhere to stereotypes, users are most active in the late evening and into the wee hours of the morning. They are least likely to sign up during work hours.
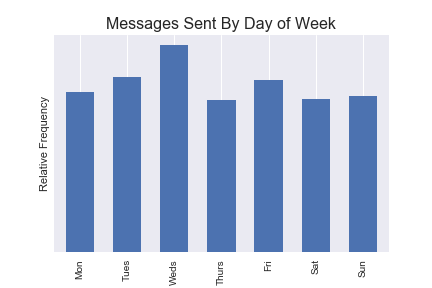
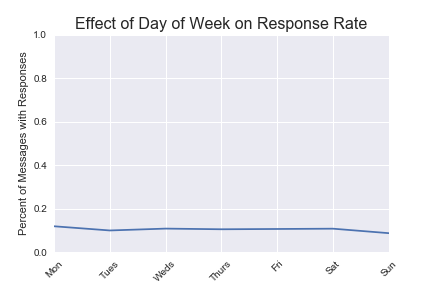
Day of Week There's not a strong day-of-week effect, although users do seem fractionally less likely to sign up over the weekend.
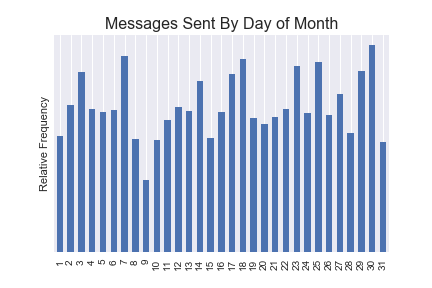
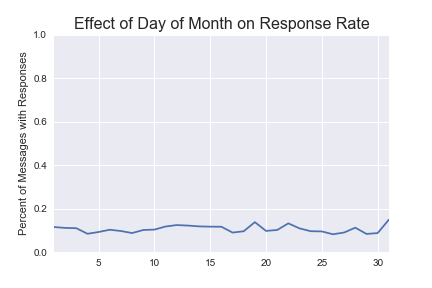
Week of Month The day of the month does seem to have a strong effect on when users sign up. For the first week, sign ups are low, but then they peak in the second week, drop in the third week, and then go back up in the fourth week. Low sign-ups on the 31st only because not every month has one.