My Metric
I scored my models based on the precision score at 93% recall. There's nothing magical about the number 93 except that it's the recall score of the baseline model. I didn't want my recall to drop, but I hope I can get the precision to improve.
How Did I Choose a Metric?
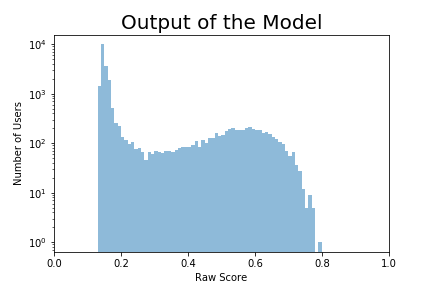
Most machine learning models output values between 0 to 1 representing, roughly, the chance the user will lock. Converting those outputs into a single digit representing the 'goodness' of the model is complicated, especially because different situations might call for a different definition of 'good'.
Here's a histogram of the values the model outputs (note the log scale on the y-axis). It's a mixture of users who actually locked and users who didn't.
It would be amazing if this model perfectly discriminated between locking and not locking users. Consider the dream model below:
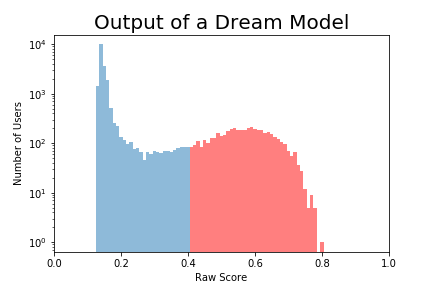
Blue users don't lock, red users do. (Note that there are A LOT more blue users; they only look comparable because of the log axis.)
This is a dream model because if I set the cutoff at .4, every single prediction greater than .4 is a locking user and every prediction below .4 is a not-locking user. The model is prefect.
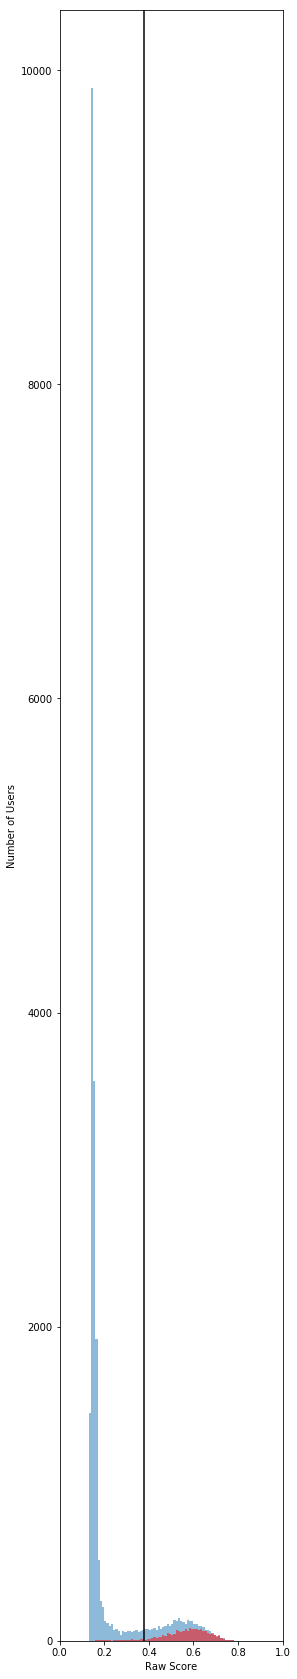
What we really have is this:
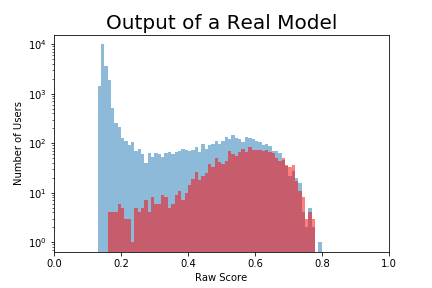
If I set the cutoff at .4, there are still a lot of locking users (red) who are falsely classified as not-locking (False Negatives). There are potential customers that Acme Co won't get because I told them not to bother.
There are also a lot of non-locking users (blue) above .4 that I falsely classified as locking (False Positives). These are low-quality customers that Acme Co will waste resources going after.
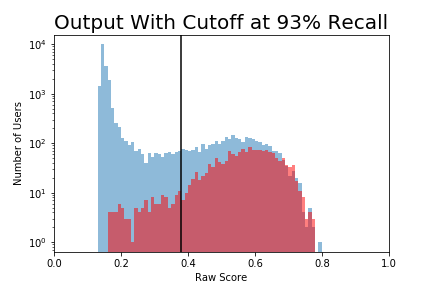
We can move the cutoff back and forth. If I set it at 0.2 I'll have very few false negatives (reds below the cutoff) but a lot more false positives. I can cut down on the false positives by moving the cutoff to the right, but then I'll increase the false negatives.
So how good is this model?
Acme Co is just starting out, so it is especially important to not miss potential customers. False Negatives are Bad. I can bring False Negatives down to 0 with a low enough cutoff, but a model that predicts "yes" all the time is not much of a model. Instead, I figured out what cutoff would give me 93% recall, meaning I capture 93% of the red region.
For your amusement, I have included this plot without a log y-axis in the margin to the right. It is very long, but does a better job of representing the number of users above and below the threshold.
Some Other Metrics and Why I Didn’t Use Them
Recall: Of the users who lock, how many did I accurately predict will lock? This is an awful metric. Consider a model where I predict everyone will lock. Suddenly, I have 100% recall! Because this metric doesn’t account for the vast majority of false positives (don’t lock but I say they do) it can be easily gamed.
Precision: Of all the users I say will lock how many do lock? Awful for the same reason. I can be extremely careful picking just the handful of users who are practically guaranteed to lock. They all lock and I have 100% precision*. Because this metric doesn’t account for all the locking users I missed (false negatives) it can also be easily gamed.
F1: F1 attempts to balance recall and precision by dividing two by the sum of their inverses. It doesn’t give extra emphasis on recall and it’s hard to interpret on its own.
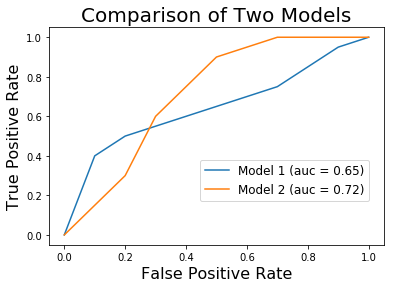
ROC area under the curve: This is a very common metric. It plots the false positive rate (percent of users who won’t lock who I say will, thereby wasting company time) against the true positive rate (recall or sensitivity, percent of users who might lock that I correctly identify, thereby allowing us to invest resources into convincing them to lock).
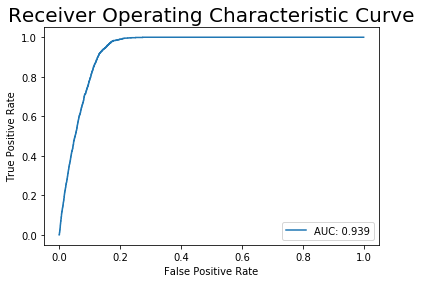
I didn’t like it for a few reasons.
- It is not very interpretable. What does it mean to have a large area under the curve?
- It considers all possible thresholds, but we’re only interested in models with high recall. In the graph below, the orange model has the higher area under the curve (0.72 vs 0.65). However, if even a 0.2 false positive rate is unacceptable, the blue model is the better choice.