Converting from Raw Score to Real Probabilities
As mentioned before, the model’s output isn’t a simple “lock” or “no lock”, but instead a value between 0 and 1 that represents the model’s confidence that that user will lock. To calculate precision and recall, we artificially set a cutoff and call anything above that a ‘lock’ and anything below that ‘not-a-lock’.
Reporting for each user only 'lock' or 'no lock' loses the subtelty of "really high score and super likely to lock" versus "right at the cutoff and could easily go either way". Suppose someone from Acme Co has two users to call but only time for one. It would be helpful to know that the first user just barely made the cutoff while the other passed it easily.
Even better would be to have a number that can be interpreted as “percent probability of locking”. Not only can we compare two users that way, but we can perhaps make plans and take risks based on accurate probabilities.
Let's go back to the graph we used when we chose a metric. We decided anything with a score above the black cutoff would be a predicted "lock" and anything with a raw score below the cutoff would be a "not-lock".
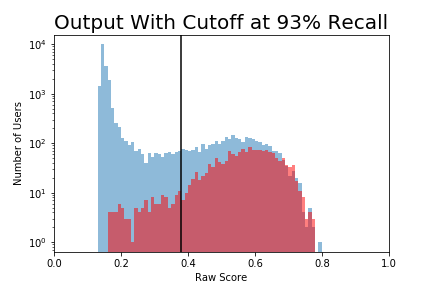
How can we convert the raw score to a percent probability? Let’s walk through the graph below. Along the x-axis are the raw scores put out by the model. This model produces scores from the low teens to the high 70s.
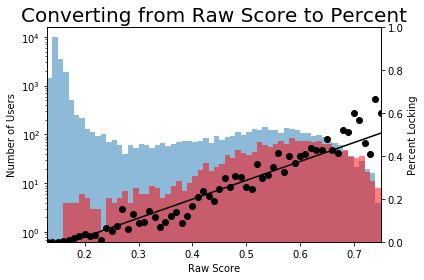
The red histogram represents how many locking users had that score, while the blue plot represents not-locking users.
Consider a raw score of .15. There are nearly ten thousand not-locking users and not a single locking user. If an unknown user has a raw score of .15 we can be extremely confident that he won’t lock.
Now consider a raw score if .65. There are about 65 locking users and 70 not-locking users. A user with a raw score of .65 is just about equally likely to be a True Positive as a False Positive.
The black scatter plot represents these probabilities. The value at .15 is 0%, while the value at .65 is 48%. I’ve added a best fit line to convert from the raw score to the percent probability.